Photo Illustration by Filip Radwanski/SOPA Images/LightRocket via Getty Images
Part of the reason why Netflix has such an impressive lead on its streaming competitors is because of its global output. Productions from all over the world land onto Netflix but which countries produce the most popular content? We’ve got the answers.
Now it’s important to note at this point that the top 10s are very much reflective of Netflix’s output alongside how popular content is. For example, if there are fewer titles from the United Kingdom in one quarter you’ll likely find that’s linked to any drop in popularity.
With thanks to FlixPatrol for providing us with this exclusive data. For those who don’t know how FlixPatrol works, they collect daily TV and movie lists from Netflix all around the world. They then compile that data assigning points (10 points to that day’s number 1, 1 point to that day’s number 10) and from that data, we can then break down popularity by numerous features whether that be by genre or in this case, by country of origin.
It should be noted that some productions could be argued to be a multi-country effort. A show like The Witcher is classed as a US show despite having involvement from production companies in the United Kingdom, Hungary, and Poland.
Movies and Shows from the United States Are The Most Popular on Netflix
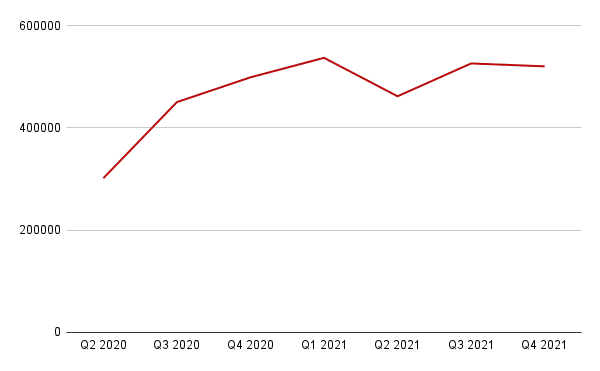
It probably shouldn’t come as any surprise that content from the United States is the most popular on Netflix being taking up 61% of the overall top 10 slots on average since Q2 2020.
Whether it’s from licensed Hollywood movies or the huge slate Netflix has produced from within the US, it shows no sign of not being the dominant country of origin for content going forward.
| Quarter | Number of Points in Top 10s | Percentage of Titles in the Top 10s |
|---|---|---|
| Q2 2020 | 301468 | 60.88% |
| Q3 2020 | 450305 | 59.84% |
| Q4 2020 | 498737 | 62.24% |
| Q1 2021 | 536876 | 66.24% |
| Q2 2021 | 461755 | 56.25% |
| Q3 2021 | 525911 | 63.16% |
| Q4 2021 | 520218 | 58.97% |
The Rise of South Korean Content Popularity
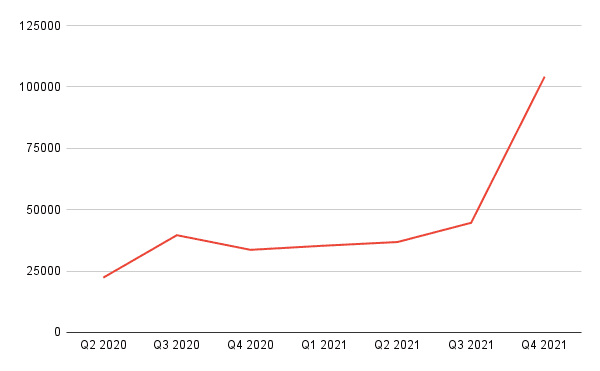
You’ve probably read a slew of articles that state Netflix is dominating when it comes to South Korean content and to an extent they’re right. Rising to the second most popular in Q4 2021, Netflix celebrated its rise in the region back in September announcing that they had made 80 shows and movies in the region. Output deals from local providers have also helped propel the countries output around the globe.
Earlier this year, we reported on the fact that Asian content had surpassed European content in popularity in the top 10s in late 2021 and now thanks to individual country data, we can report it’s almost entirely because of Korean content.
Let’s look at its rise in popularity over the past two years. Q4 2021 is likely to be an outlier with the arrival of Squid Game but Korean content has been on a slow march up the charts regardless of Squid Game.
| Quarter | Number of Points in Top 10s | Percentage of Titles in the Top 10s |
|---|---|---|
| Q2 2020 | 22333 | 4.51% |
| Q3 2020 | 39615 | 5.26% |
| Q4 2020 | 33647 | 4.2% |
| Q1 2021 | 35331 | 4.36% |
| Q2 2021 | 36833 | 4.49% |
| Q3 2021 | 44654 | 5.36% |
| Q4 2021 | 104175 | 11.81% |

Korean Content Popularity on Netflix Top 10s – Quarter vs Points
United Kingdom Content Trending Downwards
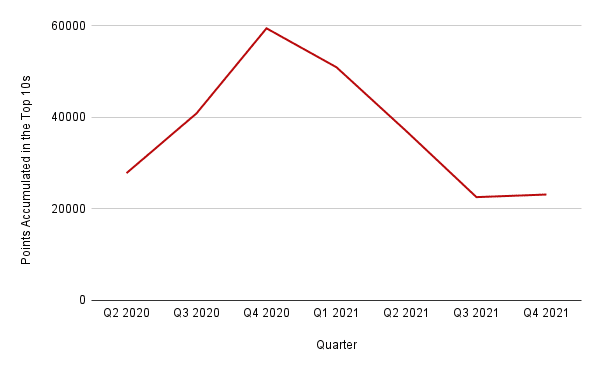
Another trend we’ve spotted over the past two years is that content from the United Kingdom struggling to make as much in the top 10s.
Again, this could be a symptom of the countries output onto Netflix (which is being significantly beefed up) but you can see below, particularly from Q2 2021 onwards, that popularity in UK content has been trending downwards.
- Q2 2020 – 5.61%
- Q3 2020 – 5.43%
- Q4 2020 – 7.41%
- Q1 2021 – 6.28%
- Q2 2021 – 4.50%
- Q3 2021 – 2.71%
- Q4 2021 – 2.62%
Competition of Spanish-language Content on Netflix
Another trend we’ve loved tracking is the Spanish-language content within the top 10s.
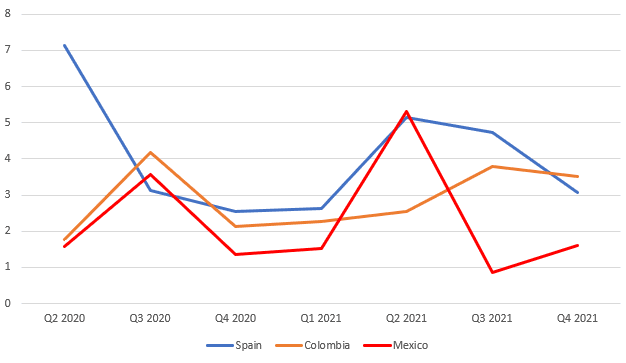
While Spanish content from Spain has mostly kept ahead of content from Colombia and Mexico, it’s a close race with all three countries (despite massive cultural differences) being popular around the globe.
Below, you can see the countries output as a percentage of popularity over time and how close the race is even if Mexico did drop in Q3 and Q4 2021.
Full Top 10 Country Popularity Over Time
For the data geeks among you, here’s a breakdown of what countries had the most titles in the top 10s for each quarter starting from Q2 2020.
| Position | Q4 2021 | Q3 2021 | Q2 2021 | Q1 2021 | Q4 2020 | Q3 2020 | Q2 2020 |
|---|---|---|---|---|---|---|---|
| 1 | United States (58.97%) | United States (63.16%) | United States (56.25%) | United States (66.24%) | United States (62.24%) | United States (59.84%) | United States (60.88%) |
| 2 | South Korea (11.81%) | South Korea (5.36%) | Mexico (5.3%) | United Kingdom (6.28%) | United Kingdom (7.41%) | United Kingdom (5.43%) | Spain (7.14%) |
| 3 | Colombia (3.5%) | Spain (4.72%) | Spain (5.13%) | South Korea (4.36%) | South Korea (4.2%) | South Korea (5.26%) | United Kingdom (5.61%) |
| 4 | Spain (3.06%) | Colombia (3.78%) | United Kingdom (4.5%) | Spain (2.64%) | Canada (2.7%) | Colombia (4.18%) | South Korea (4.51%) |
| 5 | United Kingdom (2.62%) | France (3.07%) | South Korea (4.49%) | Colombia (2.28%) | Spain (2.54%) | Poland (3.74%) | Poland (2.87%) |
| 6 | France (2.15%) | United Kingdom (2.71%) | Japan (2.96%) | India (2.03%) | Colombia (2.13%) | Mexico (3.57%) | France (2.16%) |
| 7 | Germany (2.11%) | Japan (2.43%) | Canada (2.57%) | Italy (1.8%) | France (1.97%) | Spain (3.12%) | Canada (2.06%) |
| 8 | India (2.09%) | Germany (1.96%) | Colombia (2.54%) | Mexico (1.52%) | India (1.64%) | Germany (3.04%) | Japan (2.02%) |
| 9 | Japan (1.91%) | Russia (1.79%) | China (2.04%) | Poland (1.43%) | Japan (1.48%) | France (1.83%) | Germany (1.94%) |
| 10 | Canada (1.61%) | India (1.29%) | Poland (1.88%) | France (1.28%) | Germany (1.46%) | Japan (1.55%) | Colombia (1.77%) |
Do you tend to watch only US content on Netflix or do you watch content from around the globe? Let us know in the comments.


