Antonia Gentry in episode 204 of Ginny & Georgia. Cr. Amanda Matlovich/Netflix © 2022
PlumResearch, a leading SVOD analytics company based in Poland, has revealed completion rates for some of Netflix’s biggest shows of 2023.
As we’ve discussed before, completion rates are one of the metrics many like to use when discussing shows success on Netflix. It’s a great stat because it doesn’t just show how many people are starting a show or just broad viewing hours, but it details how many people get all the way to the end of the show. Indeed, in written evidence to the UK’s government, Netflix stated that it provides its own creators with “starters” and “completers” data.
PlumResearch, which has now begun releasing its own weekly top 10 for Netflix akin to the likes of Netflix itself and Nielsen, recently shared insights into Netflix’s Q2 2023 top performers publicly and some of the Q1 2023 shows exclusively with us.
Per PlumResearch, here’s how they determine completion rates:
“Completion Rate [CR/Metric]: this metric presents the percentage of Unique Viewers (UV) who fully watched all of the episodes of a single season to all Unique Viewers (UV) who fully watched the first episode in the season. Note that the definition of a ‘fully watched episode’ is any viewing of an episode where the viewing time is at least 70% of the entire episode’s duration.”
Now let’s dig into the competition rates for a handful of shows that have been released thus far in 2023 using their United States of America data panel:
| Title | CR 7D (%) | CR 28D (%) | CR 90D (%) |
|---|---|---|---|
| Ginny & Georgia S2 | 47.90% | 69.60% | 73.70% |
| Manifest S4 | 46.90% | 68.90% | 73.10% |
| Firefly Lane S2 | 44.60% | 65.50% | 70% |
| Outer Banks S3 | 44.70% | 62.40% | 66% |
| The Night Agent S1 | 42.30% | 56.60% | 59.60% |
| Love is Blind S4 | 61.70% | 44.70% | 52.70% |
| That ’90s Show S1 | 39.10% | 47.40% | 49% |
| The Recruit S1 | 30.20% | 45.40% | 48.40% |
| Unstable S1 | 32% | 40.60% | 42.70% |
Most of the shows above have been renewed for future seasons, except Firefly Lane and Manifest, both ending with their most recent seasons.
Over the past couple of years, PlumResearch has also dropped other variation completion rate snippets, including:
- The canceled 1899 series had a higher completion rate than the first season of Dark, but seasons 2 and 3 of that show were ultimately higher. After seven days of viewing, completion was 22% for 1899 and 18% for Dark S1. After 28 days, the gap was around 3% in favor of 1899 (CR 31%).
- Stranger Things is one of the shows that have the highest completion rates, according to their data. 71.66% of watchers finished 70% of season 4 volume 1 in the first seven days
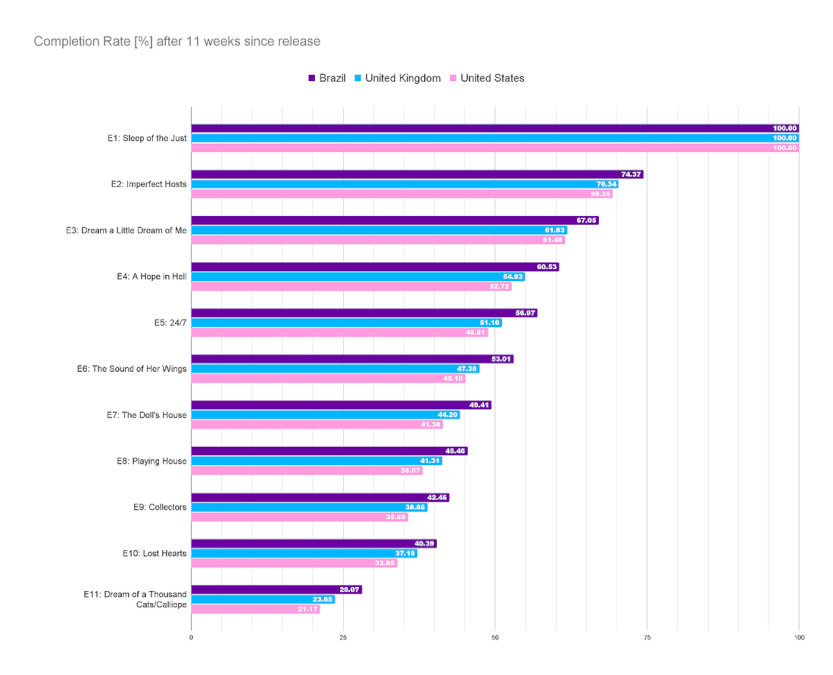
- The Sandman saw 33.86% of US viewers get to the final episode and only 21.17% watched those along with the animated episode.

The Sandman completion rates – Picture: Showlabs by PlumResearch
PlumResearch also previously shared with us that of all viewing between October 2021 and October 2022 that 49.2% of viewership in the US was spent watching Netflix Original series and 39% on Netflix Original movies.
If you love this kind of data, every week What’s on Netflix on Wednesday releases a top 10 report digging into all the data we get from Netflix, and in case you missed it, we recently dug into the biggest hits and flops of 2023 so far.


