For years, observers have bemoaned the lack of visibility into Netflix ratings. We know everyone is watching Netflix, but how often specifically? Fortunately, over the last year Netflix has released actual data about their shows and films. (What I call “datecdotes”.)
Want to see everything we’ve tracked? Well, What’s on Netflix has you covered with a whole page here and a Google Numbers sheet with all the data for you to download.
That’s a lot of numbers. But can we learn anything from it?
I think we can. I’ve tracked 30 data points for Netflix going all the way back to Bright, and we have enough data to make some calls. Further, last week Netflix released to Bloomberg their top ten most viewed films. With the big, big caveat that Netflix has released way fewer data points than they have films, let’s see what we can divine.
A Note on the Data
Every data point I’ll use today came from Netflix. Netflix only releases global data, so all of these are worldwide subscriber numbers. Most of the releases came from Netflix earnings reports, but some were released by them on Twitter.
Netflix has released two types of measurements for how many subscribers watch an original. First, they used viewers who watched 70% of a film. Then, starting this year, they moved to “2 minutes” viewed. I’ll try to convert everything to the former number, using this table (based on Netflix estimate that 2 minutes viewed inflates totals by about 35%):
To summarize, here’s what I’m looking at.
Where – Global data,
What – All converted to 70% completion of a feature film,
Who – Measuring subscribers,
When – From the end of 2018 (The Bird Box quarter) to the end of June 2020.
Insight 1 – Netflix films are drawing in progressively smaller audience as a percentage of the subscriber base.
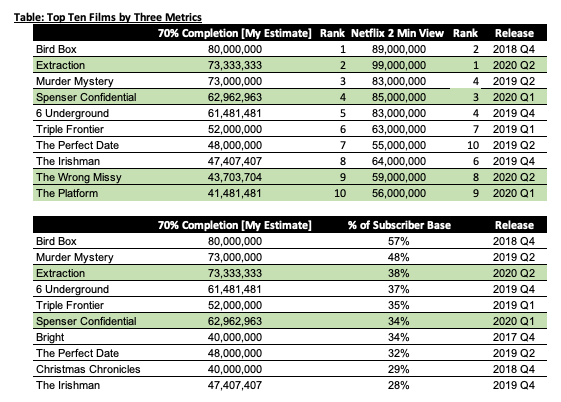
This isn’t bad news, just the reality that as a streamer gets bigger, it’s increasingly difficult to reach every subscriber with a new film. For instance, here’s two top ten lists by either total subscribers or percentage of customers viewed, with 2020 films highlighted in green.
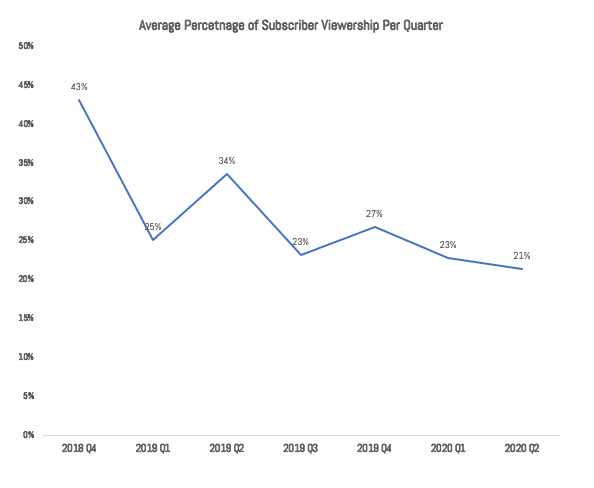
Expanding outside just the top films, and using any film getting over 20 million subscribers, you can see the downward trend of subscriber numbers over time:
This isn’t devastating news for Netflix, just a realization of the idea that films don’t appeal to every person subscribing to a service. Or even travel globally, which is where Netflix is expanding most aggressively.
However, it is bad news for the idea that at some point Netflix can pull back on content spend. If you’re running a service that has to appeal to “everyone”, you need lots and lots of content to appeal. It looks like certain types of films have ceilings.
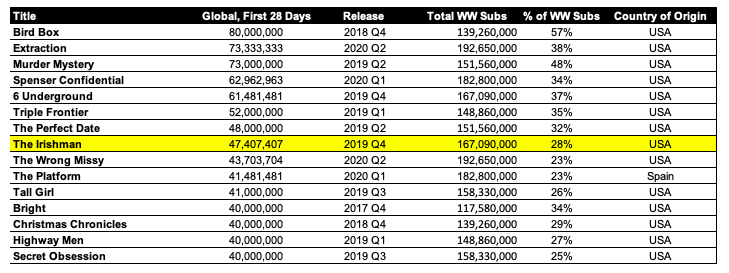
Insight 2: US films continue to dominate the top ten lists.
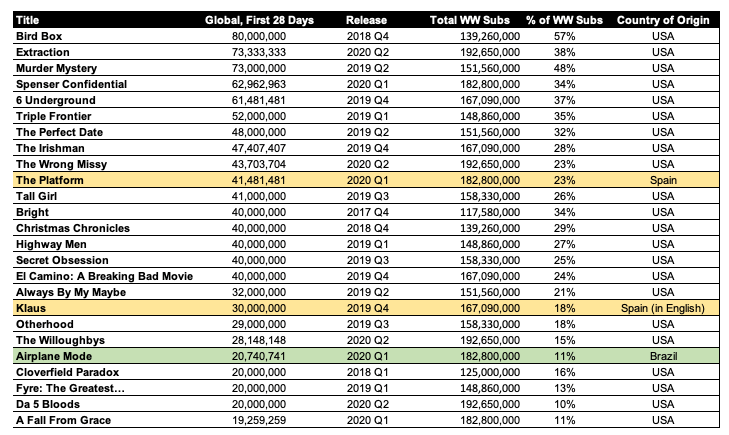
Here’s a table with Netflix’s Top 25 films highlighted by their producing country, with Spanish and Brazilian films color-coded:
Of the top ten, 9 are from the US.
Of the top 20, 19 are US or English language. Of the top 25, only three were from outside the United States.
In other words, US-produced films continue to do well on Netflix. I have two explanations for this. First, the US/Canada region is still a huge portion of total Netflix subscribers. (Over one third, and probably higher in actual usage.) US viewers tend not to opt for foreign language originals. (British films/series are the minor exceptions.)
The second explanation is that Hollywood is still the movie producing capital of the world. This lineup isn’t too different from how global box office performs, with the exception of China, where Netflix isn’t a presence.
Insight 3: Action Films Dominate the List
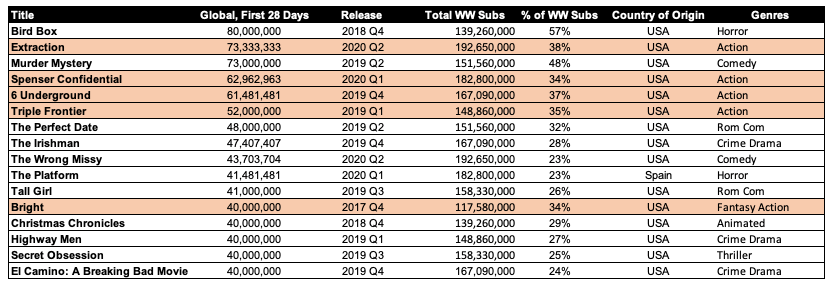
If a genre does seem to be working for Netflix, it is action films. Since last year, they’ve taken up more and more spots in the top list:
After the top 6 films, it seems to be all over the place, with a tilt towards “genre” projects likes horror, thriller or crime.
Notably, this list doesn’t match the genres that dominate the global box office. There, the list is dominated by superheroes, animated films, science fiction, and fantasy. Yet, those films require fairly large budgets that even Netflix hasn’t committed to. (Their most expensive film is likely The Irishman at north of $200 million US.)
Insight 4: The Oscar films have not done very well.
Of all the films Netflix has released for Oscar contention in the United States, The Irishman is the only film who gotten the “datecdote” treatment.
This shouldn’t be too surprising, but it does clash somewhat with the narrative that Oscar films attract lots of new subscribers.
Insight 5: Netflix does not have a “data based” edge at producing original content.
This is my most controversial opinion—one I’ve been making since early 2019—but the data of the last year has only backed this up. Despite the claims that they have an “edge” on producing films using their algorithms, the data doesn’t back this up.
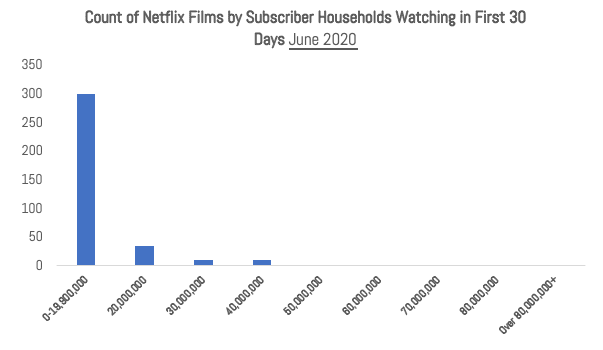
Instead, Netflix has very ordinary performance of feature films. This means that most of their films are “duds” or “bombs”, while a few have outsized performance. You can see this in the histogram of their film performance by viewership category.
This is what is called the logarithmic distribution of returns. Here’s that table showing which films they’ve released by category, and where I’ve had to estimate the films Netflix DIDN’T tell us about.
Which is worth noting. Netflix has released over 360 films since Q4 of 2017. (According to Netflix Films Reviewed.) They’ve given us data points (or Nielsen has) for only 30 of those films. Still, even if I doubled the number of films in the 20-40 million subscribers range, the shape of the curve would still hold.
Further, since Netflix released a “top ten” list, we know that only ten films or so have had 40 million subscribers, using the 70% metric (that’s about 55 million using the 2 minutes viewed metric). This was the secret insight of the Bloomberg Top Ten list: we know the top ten films which means every other film has to be below that!
Plus, based on the top ten list and their pattern of announcements, it looks like Netflix has told us their top 2 to 4 films reliably every quarter since winter of 2018 (With a few other sneaking in for various PR reasons.) The only exception seems to be The Platform from last quarter, which I can’t explain why they left it out. My working theory is its completion rate is lower as some customers may be turned off by the horror elements.
If Netflix truly had an edge on producing content—meaning their data gave them unique insights—then we’d expect to see larger “tail” effects. We’d expect a bump in films that get 60, 70 and 80 million viewers.
Instead, Netflix deliberately buys in bulk—361 films!!!—with the goal to see what works and use data to promote it. But they can’t use data proactively to develop films. (Despite constantly implying this in interviews!)
(The Entertainment Strategy Guy writes under this pseudonym at his eponymous website. A former exec at a streaming company, he prefers writing to sending emails/attending meetings, so he launched his own website. Sign up for his newsletter at Substack for regular thoughts and analysis on the business, strategy and economics of the media and entertainment industry.)


